Fluorescence Correlation Spectroscopy
Over the last decades, fluorescence correlation spectroscopy (FCS) has been successfully applied to many biological systems to study molecular transports, dynamic behavior of macromolecules, membrane structures, and organization of chromatin. By measuring and analyzing the fluorescence intensity fluctuations generated by biomolecules moving in-and-out of the microscope detection volume(s), parameters such as diffusion coefficients, molecular concentrations, and the fluorescence brightness can be calculated. The (sub)microsecond temporal resolution and the low background typically needed for FCS are usually obtained by employing a point-detector - such as a photomultiplier tube or an avalanche photodiode - in a confocal microscope system. The detector integrates all photons in the detection volume, thus ignoring all information encoded in the spatial distribution of the photons. Consequently, FCS has a limited value when studying more complex situations, e.g. FCS is not able to measure the direction of active transport in a sample undergoing anomalous diffusion. Other fluorescence fluctuation spectroscopy (FFS) techniques that do register spatial information with a camera, such as spatiotemporal image scanning correlation spectroscopy, exist, but the spatial information comes at the cost of a very poor temporal resolution.
To address this limitation, we recently built a confocal laser scanning microscope in which the traditional single-element detector was replaced with a 5x5 pixel single-photon-avalanche-diode (SPAD) array detector, see Figure 1. Each pixel of the detector produces almost instantaneously a logical-high voltage when hit by a fluorescence photon. Consequently, for each pixel, the arrival time of every photon can be registered with sub-nanosecond temporal resolution, independently from and asynchronously with respect to the other pixels. In combination with a pulsed laser source, such a setup offers the additional advantage of being able to simultaneously measure the fluorescence lifetime.
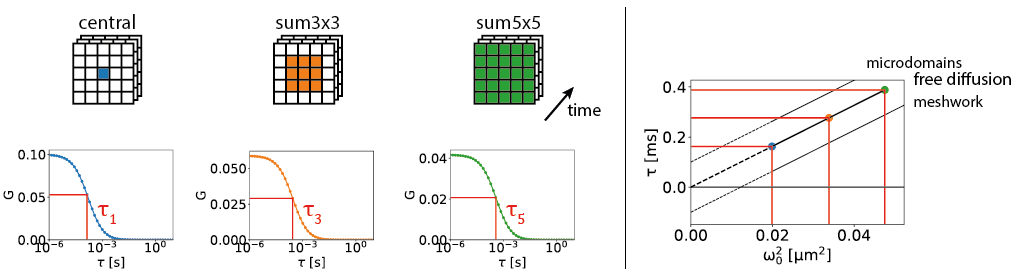
The high-resolution spatial and temporal information can be analyzed in several different ways. E.g. the FCS detection volume can be chosen in post-processing by summing the intensity traces of multiple pixels. One can for example calculate three intensity traces, I_12(t), I_sum3x3(t), and I_sum5x5(t). I_12(t) is the intensity trace of the central pixel, I_sum3x3(t) the trace of the nine most central pixels, and I_sum5x5(t) the sum of all pixels. I_12(t) will then correspond to an FCS experiment with a diffraction-limited focal volume, I_sum3x3(t) with a slightly larger focal volume, and I_sum5x5 with an even larger one. Analysing the diffusion time, i.e. the average time a molecule spends in the focal volume, as a function of the focal volume size gives information on the type of diffusion: free diffusion produces a proportional relationship between the diffusion time and the square of the size of the focal volume, while microdomains in the sample or diffusion through a meshwork result in a different relationship, as shown in Figure 2.
Apart from summing intensity signals, one can also calculate cross-correlations between pairs of pixels. This is equivalent to two-focus FCS (also called pair-correlation FCS); each pixel has a different position in the image plane, thus each pixel also has a field-of-view that is slightly shifted with respect to the other pixels. Not only does pair-correlation analysis provide an accurate measure of the diffuion coefficient, it also removes spurious correlations at short lag times, caused by detector afterpulsing or noise.
A crucial advantage of the SPAD array detector with respect to other cameras is its superior speed. This opens up the possibility to perform fluorescence lifetime fluctuation spectroscopy (FLFS). The arrival time information can be used (1) to remove unwanted correlations such as detector afterpulsing, (2) to measure the diffusion properties of a mixture of different species that emit in the same spectral range, and (3) to combine FCS with FRET.